Benchmarking & Performance
The engine ships nine benchmark surfaces — one latency comparison, one CI regression gate, one concurrency stress probe, three footprint measurers (on-disk size, per-entrypoint closure, and peak heap), a latency-chart renderer, a latency-snapshot freshness gate, and a durable-store benchmark. This page documents the methodology behind each — how a measurement is made trustworthy, what a gate measures, and how to run it. Run instructions live in 05 — Verification & Testing.
The measured numbers live in the root README.md (Size & memory footprint,
Latency), regenerated from bench/*-data.json and rendered into the committed
docs/assets/*.svg charts. The wiki deliberately does not duplicate them:
latency, size, and peak-heap values are machine-specific snapshots (Deno
version, hardware, run-to-run noise) that go stale without telling a reader
anything structural. Run deno task bench, deno task bench:size, or
deno task bench:memory for your own numbers.
| Tool | Task | Measures | Gate |
|---|---|---|---|
bench/engine_bench.ts |
deno task bench |
Query/update latency vs Comunica + Oxigraph | no |
bench/budget.ts |
deno task bench:check |
Query latency regression gate (per-row budgets; rows recorded to the CI job summary) | CI |
bench/concurrency-probe.ts |
(manual) | EXISTS snapshot isolation under concurrency | no |
bench/measure-libs.ts |
deno task bench:size |
On-disk footprint of each engine | no |
bench/measure-closures.ts |
deno task bench:size:closures |
Per-entrypoint import closure (what each subpath loads) | no |
bench/collect-memory.ts |
deno task bench:memory |
Peak heap during execution | no |
bench/latency-chart.ts |
deno task bench:latency |
Renders the deno bench --json latency snapshot into docs/assets/chart-latency.svg |
no |
bench/latency-check.ts |
deno task bench:latency:check |
Fails when the committed snapshot’s bench inventory is stale vs a fresh run | CI |
deno task bench — three-engine latency comparison
bench/engine_bench.ts runs the wazoo engine against
@comunica/query-sparql-rdfjs-lite and Oxigraph (WASM) over identical
generated graphs. Deno’s built-in bench runner times each group, with the wazoo
engine as the per-group baseline.
Why the timings are trustworthy
- Verification first. Before any timing, every query asserts all three
engines return identical results (
verifySelectEquality,verifyAskEquality,verifyConstructEquality,verifyConstructIsoEquality— CONSTRUCT under the graph-result multiset contract: reference deduplicated, wazoo as-emitted (issue #87) — and every update asserts identical final store contents on fresh stores (verifyUpdateEquality). A benchmark of a broken engine fails loudly, not silently. - Self-restoring updates. The timed update deletes and re-inserts the same quads, netting to zero per iteration, so the benchmark stores never drift.
- Per-group baselines. Each group is timed independently; results are per-iteration averages over the runner’s sample window.
Groups cover the feature surface: scan, join, asym-join (reorder on/off), reorder-chain, ask, construct, update, optional, minus, union, path, group-aggregate, filter-expr, order-limit, distinct, values-bind, graph, from, subquery, exists, cast, string-fn, having, reduced, update-ops.
The committed snapshot as a chart — one row per query class, three bars per row (wazoo green, Comunica orange, Oxigraph blue), bar length proportional to average latency within the row:
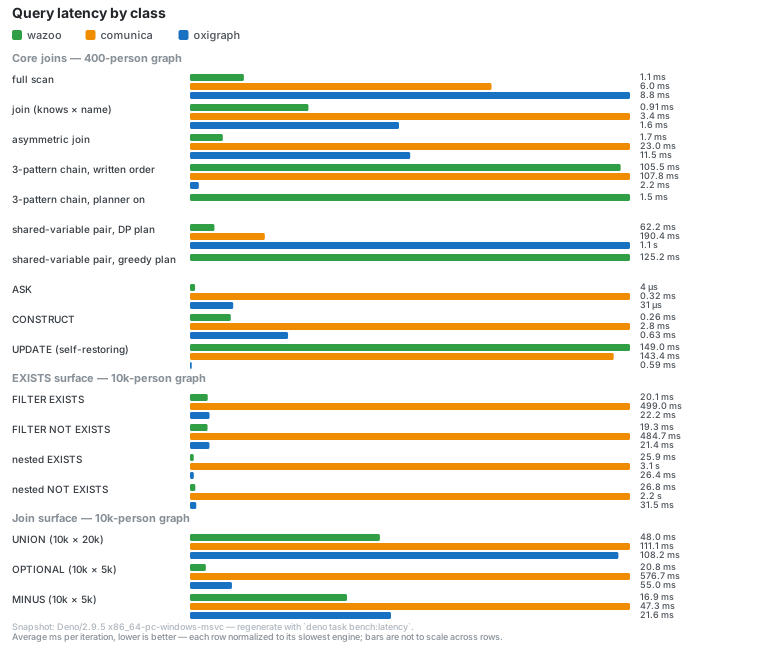
The qualitative story the numbers tell is captured in 02 — System Architecture & Query Pipeline, Stage 3: the wazoo hash join probes an indexed right side per left binding (sub-quadratic join scaling), the EXISTS snapshot is drained and indexed once per query (flat cost as data grows), and the dynamic join planner removes the worst-case-ordered chain penalty.
deno task bench:check — regression budget
bench/budget.ts is the CI perf gate. It runs four queries — a 2-pattern BGP
join, the reorder chain, an EXISTS filter, and a nested EXISTS filter — against
a 100-subject store, measuring each as the median of five interleaved rounds of
30 iterations (after a short warmup), and fails if any row’s median round
average exceeds that row’s budgetMs ceiling (the budgets live as per-test
values in bench/budget.ts; bench/baseline.json records the durable-store
comparison and does not gate this task).
Interleaving the tests round by round means no query owns a contiguous slice of machine time, and gating on the median discards a transient runner spike that lands in one round — the single 50-iteration average gave one slow stretch the power to fail exactly one test (which is how a noise-slowed CI runner red-gated an at-parity PR before the median protocol).
Budgets are calibrated to the GitHub Actions runner — the environment the gate actually runs in — at roughly 2.5–3× the median of recent main-branch CI runs, with headroom over the slowest observed run. CI runners vary widely, so a single-run calibration under-budgets noise: the chain row was originally calibrated from one lucky-fast run, and a later noise-slowed runner red-gated a PR whose code an A/B benchmark proved at parity. Recalibrate only from the median of main-branch CI history — never from one run, and never from a local machine (~3× faster than CI); catastrophic algorithmic regressions (≥3×) still trip every row instantly.
On GitHub Actions the gate also records what it measured: every row’s
median/min/max round average, its budget, and its verdict are appended to the
job summary ($GITHUB_STEP_SUMMARY) as a markdown table plus a raw JSON block.
CI runs therefore accumulate a per-run measurement record for free — when a
budget next needs recalibrating, aggregate the JSON blocks from recent
main-branch runs into a real distribution instead of hand-scraping run logs (how
the current calibration numbers were recovered). Outside CI the recording is a
silent no-op.
bench/concurrency-probe.ts — EXISTS concurrency stress
Standalone probe for issue #72 (a concurrent execute() must never observe
another call’s EXISTS snapshot rebuild). Five queries cover the EXISTS surface —
flat, NOT EXISTS, nested, ORDER BY, and GROUP BY + OPTIONAL — over a
300-subject store:
- Static-store concurrency — 40 rounds of a shuffled query mix run via
Promise.all, asserting every round matches the sequential baseline byte-for-byte. - Update interleaving — 20 rounds of a self-restoring DELETE/INSERT UPDATE running concurrently with EXISTS queries, asserting no call errors (exact results are undefined mid-mutation).
Any error or divergence exits 1; the same guarantees are locked in as unit tests
in src/wazoo-sparql-engine.test.ts.
deno task bench:size / bench:memory — footprint
Methodology
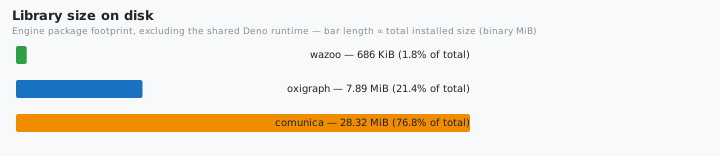
bench:size—bench/measure-libs.tsmeasures the on-disk footprint a consumer must install: the wazoo JSR publish artifact (src/+README.mdLICENSE, broken down by top-level module), the installed Oxigraph npm package (WASM binary vs JS glue), and@comunica/query-sparql-rdfjs-liteplus its full transitive dependency closure →bench/size-data.json.
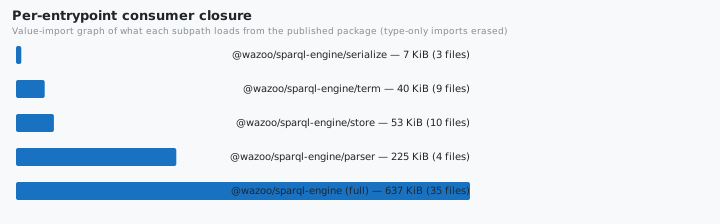
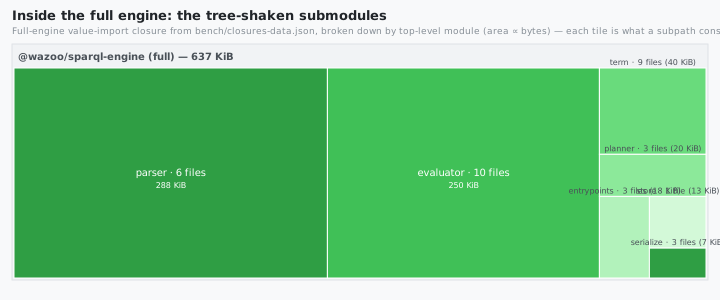
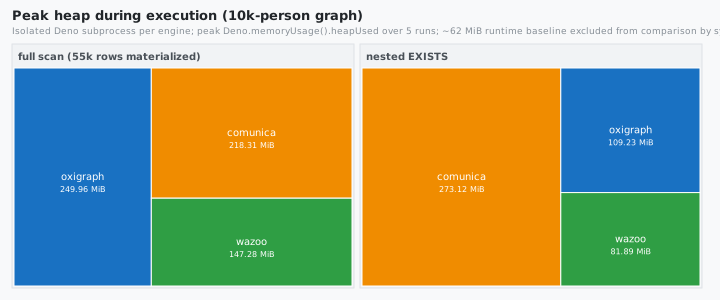
bench:memory—bench/collect-memory.tsspawnsbench/memory-probe.tsper engine × workload in an isolated Deno subprocess (so only the target engine is loaded), executing each workload 5× and reporting peakDeno.memoryUsage()(heapUsed+rss+external) on a 10,000-person graph (~55,000 quads) →bench/memory-data.json.bench/treemap.tsrenders the JSON snapshots intodocs/assets/chart-library-size.svg(bar chart),docs/assets/treemap-memory.svg(treemap),docs/assets/chart-closures.svg(bar chart), anddocs/assets/treemap-submodules.svg(full-engine closure treemap) — the SVGs are committed, so the published wiki and README stay in sync with the measurements.
The committed charts:
Regenerating and committing results
deno task bench        # latency: prints tables, verifies results first
deno task bench:check  # CI gate: per-row latency budgets (job summary on CI)
deno run --allow-all bench/concurrency-probe.ts   # exit 1 on any divergence
deno task bench:size   # measure-libs → size-data.json → chart SVGs → fmt
deno task bench:size:closures # measure-closures → closures-data.json → closures chart + submodule treemap SVGs → fmt
deno task bench:memory # collect-memory → memory-data.json → memory treemap SVG → fmt
deno task bench:latency:check  # CI gate: fresh run vs committed latency snapshot (inventory)
All measurements are machine-specific snapshots, not guarantees. When you
regenerate bench:size, bench:memory, or bench:latency, commit the updated
bench/*-data.json and the docs/assets/*.svg together — the tasks format
the SVGs, so a committed SVG should always be byte-identical to what deno fmt
produces. bench:latency:check compares only the bench inventory
(group/name/baseline) against a fresh deno bench --json run — timing values
are machine-specific and never compared.